Wealth Management
/ Investments & Research
commonwealth.com
For Advisor Use Only
21
Older investors, on the other hand, have more financial
capital than human capital, given that they have a shorter
time horizon before they reach retirement and a larger
accumulated asset base.
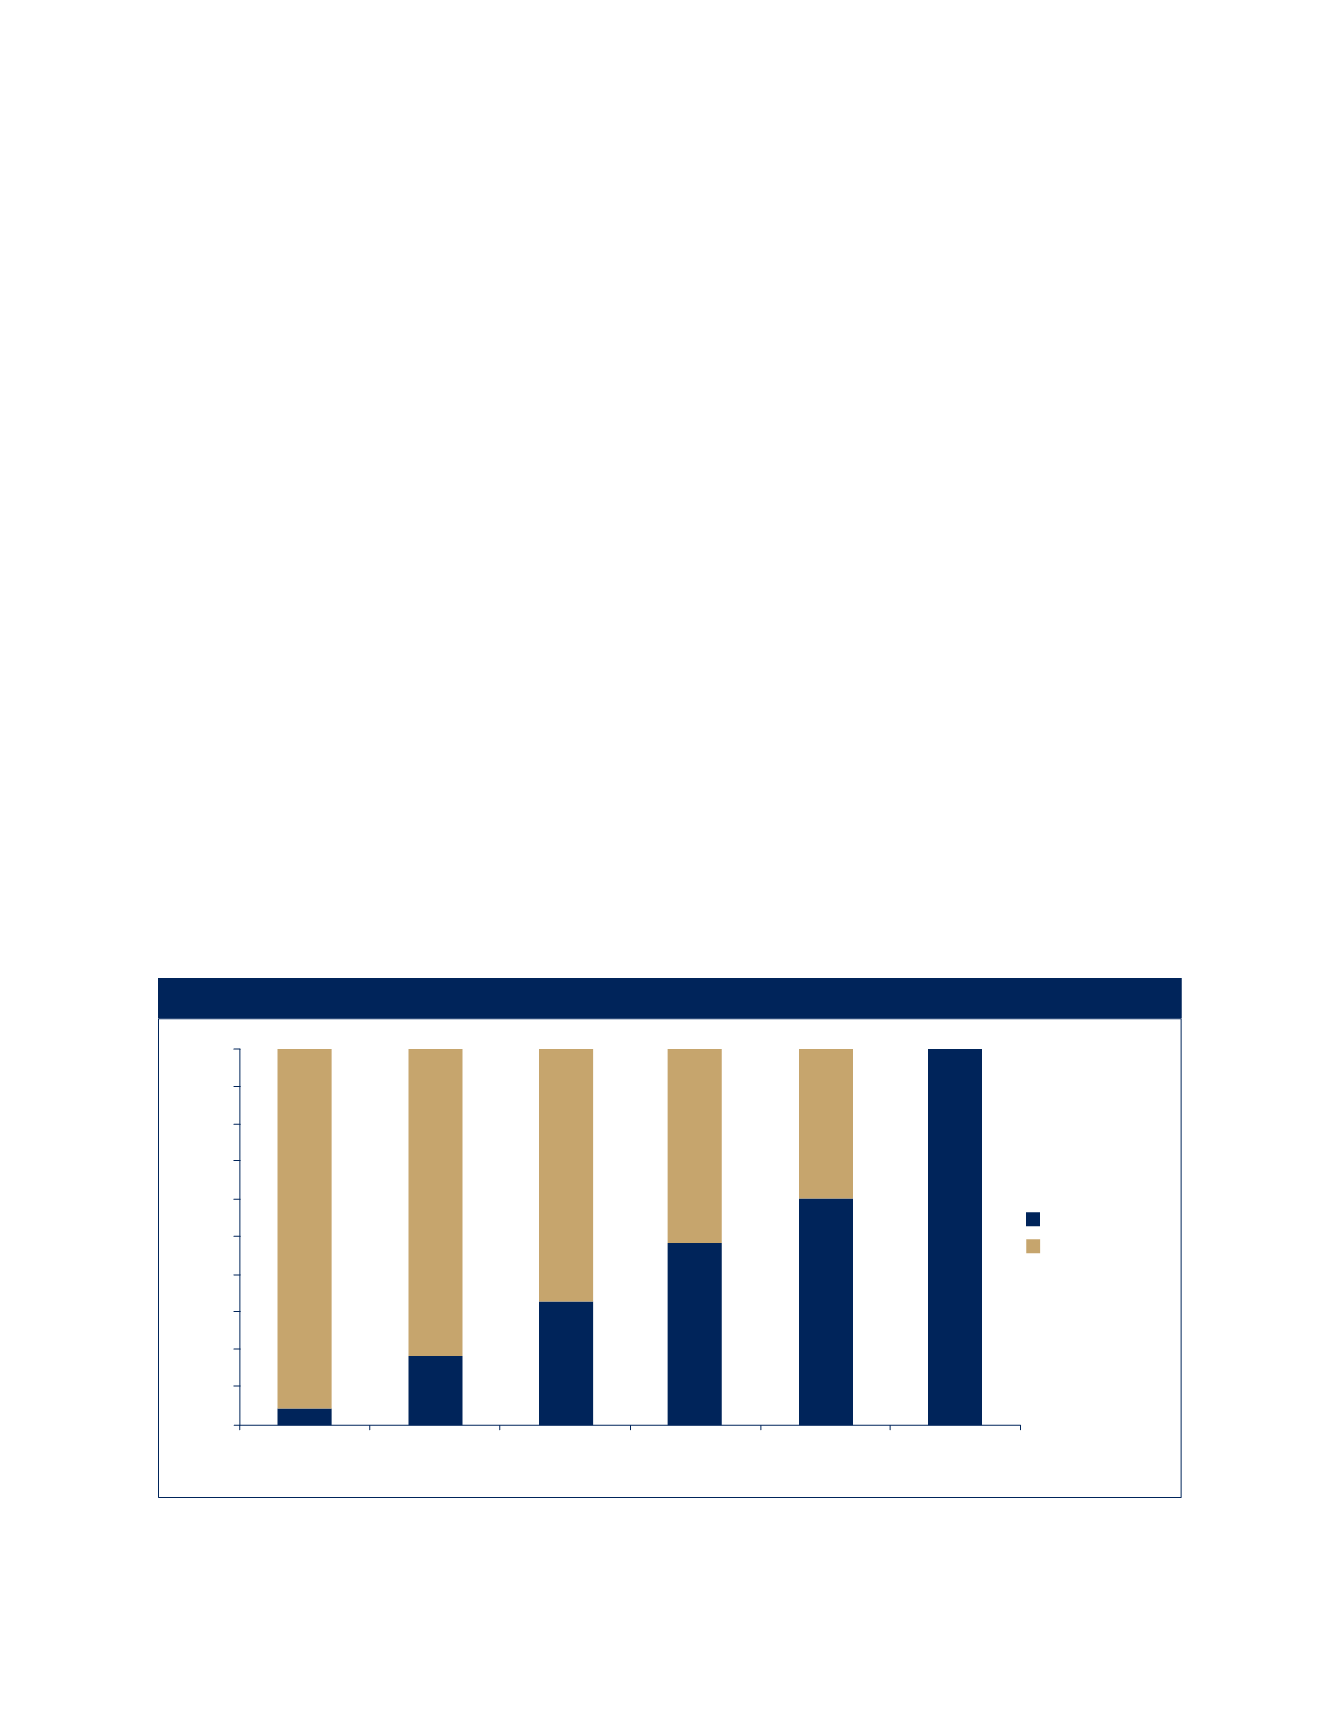
For example, an average 25-year-old investor with a
$50,000 salary growing at 2 percent per year and
$10,000 in current investments will have a distribution
of human and financial capital similar to the one
illustrated in Figure 2.
It’s evident from Figure 2 that the human capital
component is the largest piece of total wealth (human
plus financial capital) for a young investor in this scenario,
coming in at around 96 percent. As the investor progresses
through the earnings cycle, the proportion of financial
capital to human capital grows, through compounding
and additional contributions. Upon retirement—in
Figure 2, age 70—financial capital is the largest portion
of total wealth because at that point human capital ceases
or diminishes significantly. So what does this mean from
an asset allocation perspective?
Human Capital and Asset Allocation Decisions
Think of human capital as having similar characteristics
to a fixed income instrument. Like a bond, it generally
consists of future payments that can be discounted back
to the present to determine the value of the theoretical
“security.” Therefore, for the purpose of asset allocation,
human capital should be considered as one would consider
a fixed income position.
According to Ibbotson Associates, if investors omit the labor
income component when formulating their asset allocation
decisions, they will ultimately end up with suboptimal
asset mixes. As a result, it is advised that investors use a
human capital portfolio (100-percent bond), in addition
to a financial capital portfolio, when making strategic
allocation decisions. The combination of human capital
and financial capital would equal the client’s total wealth.
Life cycles and characteristics should play an important
role in how investors view the human capital portion of
their total wealth. For instance, investors with safe labor
income should generally invest more of their financial
100%
90%
80%
70%
60%
50%
40%
30%
20%
10%
0%
25
35
45
Age
55
65
70
Financial Capital
Human Capital
Source: Commonwealth, Ibbotson Associates
Figure 2. Distribution of Financial and Human Capital Over Time


